

The question appeared in the Non-Technical Forum. However, I think the content is more appropriate here.
Ammo testing at 25 yards
I think testing at 25 yards can be an effective tool for evaluating ammo, equipment modifications, etc. For me, it is essential. I don't have access to an indoor range, and wind at my local facility typically dominates, obscuring differences between alternatives. I might get one or two opportunities per year to shoot in light wind, and even then only for an hour or two.
The major advantage of shooting at shorter distances is that the influence of the wind is disproportionately less. It decreases by roughly a factor of four at half the distance (it's actually more complicated than this) whereas the inherent ammo dispersion decreases by roughly a factor of two. In technical terms, the signal-to-noise ratio improves by roughly a factor of two.
That being said, I can understand why some people have misgivings. One must overcome at least three potential obstacles to obtain meaningful results:
1. Be able to measure smaller impact variations when targets are placed closer.
2. Based on results at shorter distances, predict what will happen at longer ones.
3. Must shoot enough rounds to draw valid conclusions.
The last potential obstacle is not unique to testing at shorter distances. Anecdotal (i.e. insufficient numbers of) observations using any measurement system most likely will lead to errant conclusions. Though once in a while, anecdotal observations may turn out to be correct.
1. Differences are small.
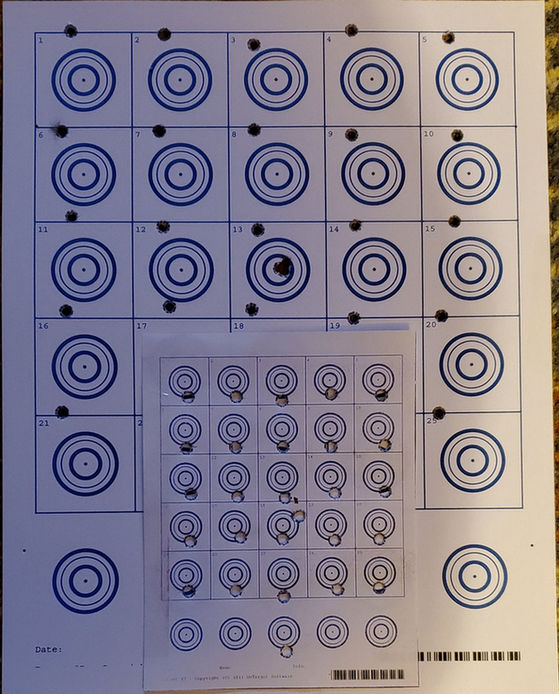
Typically I'll put one round into each of 120 bulls printed on an 8-1/2" x 11" sheet of card stock. Without rushing, that usually takes about 45 minutes. Then I'll scan the target, and analyze using TDS OnTarget software.
For example, below is the TDS analysis of the superimposed impacts for 100 rounds (two boxes) of a particular lot.

Figure 1 - TDS analysis summary for 100 rounds of lot 1116-04257.
If I had taken the time to ensure that the scope was zeroed, all would have scored "100". LOL.
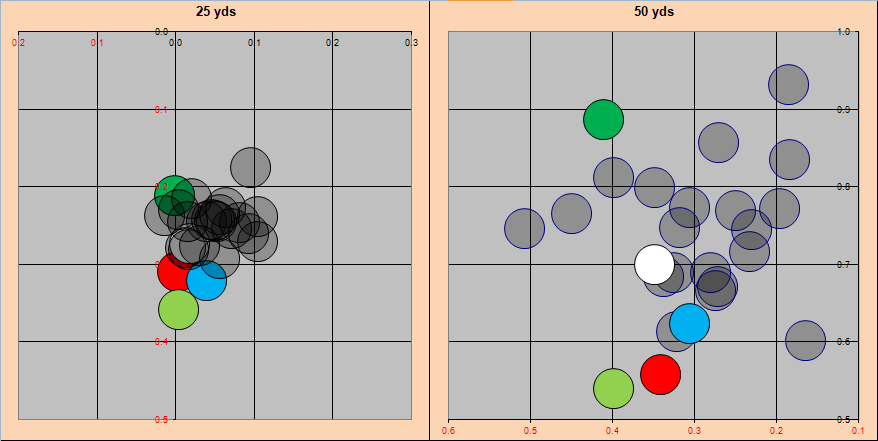
Unless a lot is horrific, just about all good target ammo will appear similar. That isn't particularly useful, although the plot qualitatively indicates that the distribution is rather symmetrical. Trying to measure groups is equally futile.
On the other hand, even when using a basic inexpensive home printer/scanner/FAX machine, precise locations of each impact can be determined. For example, the vertical location of each round is shown below. Open, and filled-red, circles correspond to the first and second box, respectively.

Figure 2 - vertical impact locations of 100 rounds of lot 1116-04257.
The small slopes are statistically insignificant.
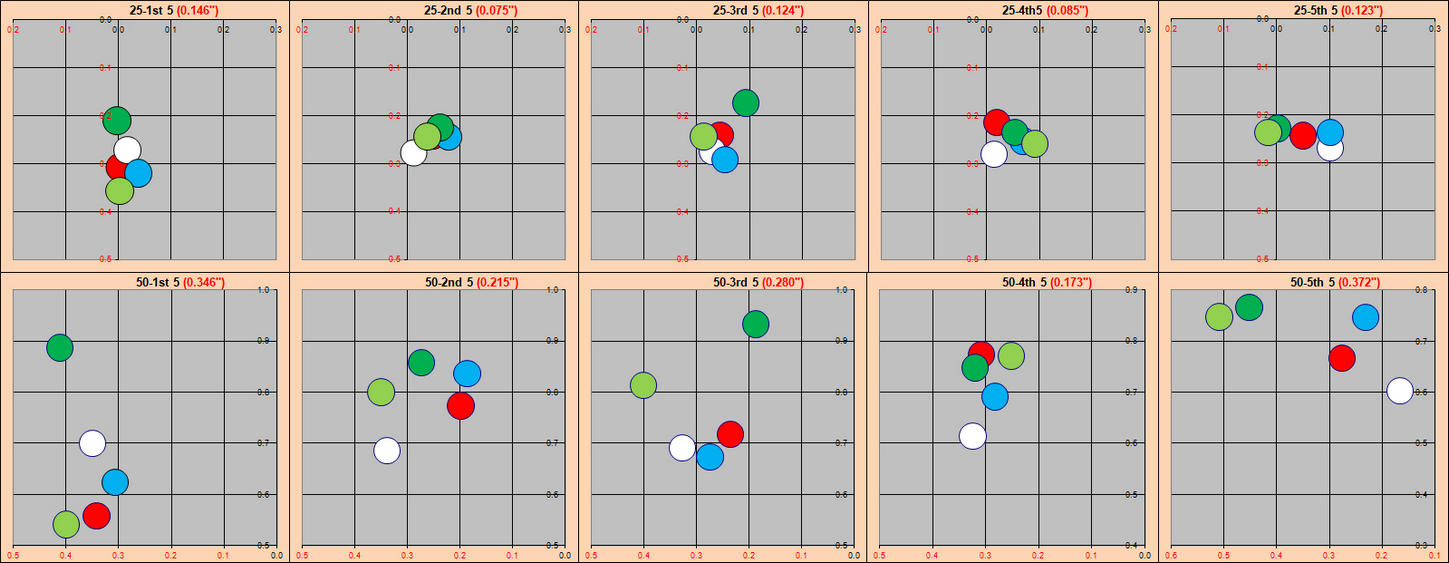
It's a fair question whether the impact variations are real. How much uncertainty do the scanner and/or the software introduce? After scanning and analyzing the target, I rotated it 180 degrees, re-scanned, and re-analyzed. A plot of the second versus the first set of locations is shown below.

Figure 3 - second versus first vertical impact locations of 100 rounds of lot 1116-04257.
This is an excellent example of a capable measurement system. The error it introduces (SD = 0.0038 in) is much smaller than the range of measured values.
Conclusion: It is possible to accurately measure impact locations at 25 yards. This permits us, among other things, to calculate standard deviations and mean radii of distributions. As shown in Figure 1, SDx = 0.044 in, SDy = 0.046 in, and MR = 0.056 in.
Next: What to expect at 50 yards?
Thanks for reading.
Albert
copyright 2019 Albert Highe
Ammo testing at 25 yards
I think testing at 25 yards can be an effective tool for evaluating ammo, equipment modifications, etc. For me, it is essential. I don't have access to an indoor range, and wind at my local facility typically dominates, obscuring differences between alternatives. I might get one or two opportunities per year to shoot in light wind, and even then only for an hour or two.
The major advantage of shooting at shorter distances is that the influence of the wind is disproportionately less. It decreases by roughly a factor of four at half the distance (it's actually more complicated than this) whereas the inherent ammo dispersion decreases by roughly a factor of two. In technical terms, the signal-to-noise ratio improves by roughly a factor of two.
That being said, I can understand why some people have misgivings. One must overcome at least three potential obstacles to obtain meaningful results:
1. Be able to measure smaller impact variations when targets are placed closer.
2. Based on results at shorter distances, predict what will happen at longer ones.
3. Must shoot enough rounds to draw valid conclusions.
The last potential obstacle is not unique to testing at shorter distances. Anecdotal (i.e. insufficient numbers of) observations using any measurement system most likely will lead to errant conclusions. Though once in a while, anecdotal observations may turn out to be correct.
1. Differences are small.
Typically I'll put one round into each of 120 bulls printed on an 8-1/2" x 11" sheet of card stock. Without rushing, that usually takes about 45 minutes. Then I'll scan the target, and analyze using TDS OnTarget software.
For example, below is the TDS analysis of the superimposed impacts for 100 rounds (two boxes) of a particular lot.
Figure 1 - TDS analysis summary for 100 rounds of lot 1116-04257.
If I had taken the time to ensure that the scope was zeroed, all would have scored "100". LOL.
Unless a lot is horrific, just about all good target ammo will appear similar. That isn't particularly useful, although the plot qualitatively indicates that the distribution is rather symmetrical. Trying to measure groups is equally futile.
On the other hand, even when using a basic inexpensive home printer/scanner/FAX machine, precise locations of each impact can be determined. For example, the vertical location of each round is shown below. Open, and filled-red, circles correspond to the first and second box, respectively.
Figure 2 - vertical impact locations of 100 rounds of lot 1116-04257.
The small slopes are statistically insignificant.
It's a fair question whether the impact variations are real. How much uncertainty do the scanner and/or the software introduce? After scanning and analyzing the target, I rotated it 180 degrees, re-scanned, and re-analyzed. A plot of the second versus the first set of locations is shown below.
Figure 3 - second versus first vertical impact locations of 100 rounds of lot 1116-04257.
This is an excellent example of a capable measurement system. The error it introduces (SD = 0.0038 in) is much smaller than the range of measured values.
Conclusion: It is possible to accurately measure impact locations at 25 yards. This permits us, among other things, to calculate standard deviations and mean radii of distributions. As shown in Figure 1, SDx = 0.044 in, SDy = 0.046 in, and MR = 0.056 in.
Next: What to expect at 50 yards?
Thanks for reading.
Albert
copyright 2019 Albert Highe
Last edited: